
All regional cities included in the report are forecast to see positive house price growth over the coming three years. Some are likely to benefit from the overflow and affordability challenges of our larger markets in Sydney and Melbourne, while others are likely to benefit from lifestyle changes.
Wollongong
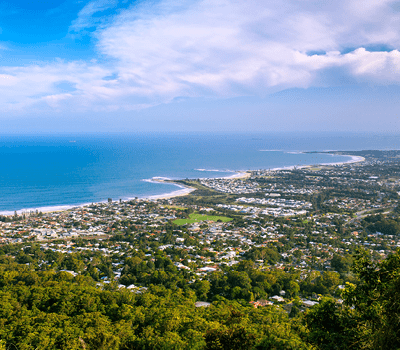
Wollongong is the largest city in the Illawarra region and maintains a diversified economy. Improving economic conditions have increased employment prospects in Wollongong and the surrounding Illawarra region, creating an increased level of inward migration. With better affordability and proximity to Sydney, Wollongong and the Illawarra region is an attractive destination for people working in Sydney. At the 2016 Census, 26% of full time workers residing in the Wollongong LGA commuted to Sydney for work. The region also attracts downsizers and those seeking a sea change in retirement.
The Wollongong residential market saw strong price growth averaging 15.4% per annum in the three years to June 2017. However, over the year to June 2018, median prices fell by 2.8% (to $734,900) as the surge in construction activity has been adding significant levels of supply to the residential market.
Read more about Wollongong property prices: download the report.
Newcastle and the Hunter region
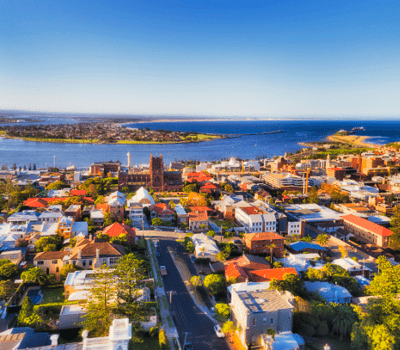
Over the five years to June 2018, Newcastle experienced solid price growth, averaging 7.7% per annum. However, this growth was significantly lower in comparison to Sydney and other major population centres in NSW due to weakening investment in the coal industry of the region.
Newcastle is further away from Sydney than Wollongong and is less connected to the Sydney employment market. Prices are more reflective of local incomes. The median house price in Newcastle sits below the threshold for the stamp duty exemption for first home buyers and therefore offers a more affordable entry into the housing market than Sydney.
Employment growth in the greater Hunter Region has strengthened and the unemployment rate in the Newcastle and Lake Macquarie region is down to 5.6% in June 2018, from 7.9% in June 2015. New dwelling commencements have picked up in recent years, culminating in an annual increase of 27% in 2017/18. The vacancy rate currently sits at 1.9% (as at June 2018), down from 2.3% 12 months prior, although recently commenced projects are yet to hit the market.
Read more about Newcastle and the Hunter region property prices: download the report.
Ballarat
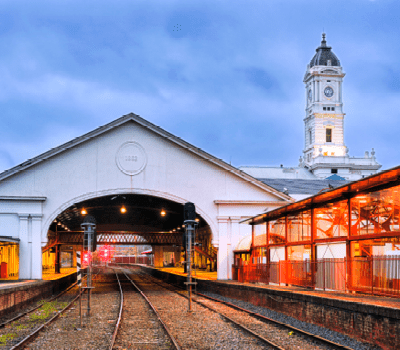
Over the past two years, the median house price in Ballarat has grown at a rate of 6.9% per annum. Population growth has been solid, and the region is benefiting from growing non-residential building activity, relatively low unemployment and tight vacancy rates. Increased first home buyer demand from commuters to Melbourne is also likely to have contributed to price growth in 2017/18 as purchasers took advantage of stamp duty concessions to enter this affordable market.
Read more about Ballarat property prices: download the report.
Bendigo
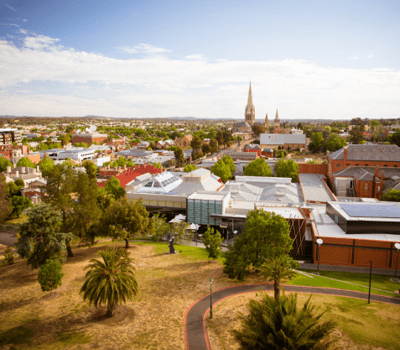
Over the past year, median house price growth in Bendigo has been flat, remaining at $350,000. Since the commencement of the Bendigo Hospital in 2013/14, there has been no major growth driver for the Bendigo region. The volume of new residential property approvals had been in decline over the four years to 2016/17, but the commencement of almost 200 retirement homes – part of the nearby GemLife Woodend development – has caused a jump in new construction activity for attached dwellings.
Read more about Bendigo property prices: download the report.
Geelong
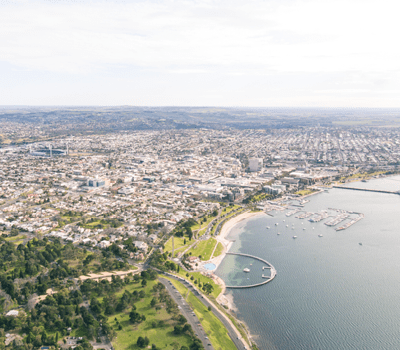
Geelong house prices have continued to grow strongly over 2017/18, surpassing expectations. The loss of car manufacturing in the area in late 2016 was expected to dampen demand and price growth in Geelong. Instead, the region has benefited from strong service sector employment and population growth. While Melbourne house prices have been in decline since the start of 2018, prices in Geelong have only just started to decline in the June 2018 quarter (falling by 1.5%). Over 2017/18, Geelong median house prices increased by 9.6% (compared to a 1.6% decline for Melbourne).
Read more about Geelong property prices: download the report.
Gold Coast
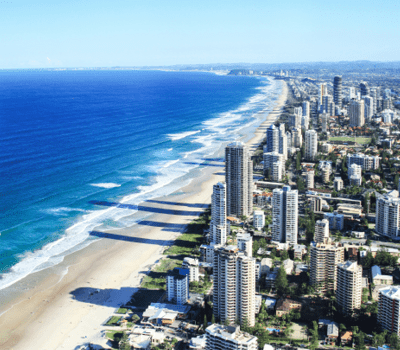
Hosting the Commonwealth Games and associated works, along with other infrastructure projects including the second phase of the Gold Coast Light Rail project and the expansion of Jupiter’s Casino, has contributed to a boost in local economic activity and employment. However, the local economy looks set to cool slightly as the area awaits the next round of infrastructure projects. The median house price on the Gold Coast grew an average of 7.8% per annum over the two years to June 2017. However, a strong uptick in supply through 2015/16 and 2016/17, coupled with softening demand, saw slower growth of 1.5% in the year to June 2018. With a strong supply pipeline also in the unit market, the median unit price has fallen by 2.4% to $415,000 in the year to June 2018. The tightened credit environment is also likely impacting Gold Coast investors.
Read more about Gold Coast property prices: download the report.
Toowoomba
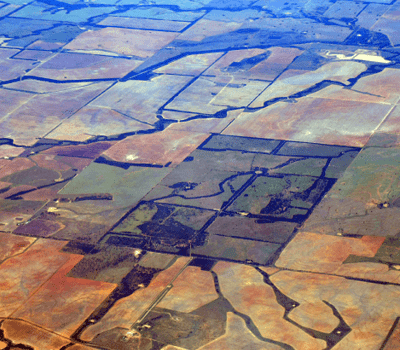 Toowoomba benefits from its proximity to agricultural hubs in the Darling Downs and sits on the Melbourne to Brisbane freight route. A slowdown in building activity and the completion of some large infrastructure projects has seen the local economy slow with unemployment sitting at 5.2% in June 2018, up from 4.9% 12 months earlier. The median house price has fallen by 5% in the past 12 months, reaching $380,000 at June 2018.
Read more about Toowoomba property prices: download the report.
Sunshine Coast
Population growth of 2.5% in 2016/17 meant that the Sunshine Coast was the fastest growing of all population centres in Queensland. After a long period of undersupply, rising construction has reduced the dwelling deficiency, and vacancy rates have begun to edge upward, albeit remaining low at 2%. In the year to June 2018, house price growth on the Sunshine Coast outperformed both Brisbane and the Gold Coast, with the median increasing by 3.0%.
Read more about Sunshine Coast property prices: download the report.
Cairns

The Cairns economy is dependent on tourism to drive employment and local economic growth. As a result, Cairns has been less affected by the recent downturn in the resources industry than Townsville. A lower Australian dollar is increasing the attractiveness of Cairns as a holiday destination for tourists. Job prospects are improving, leading to a pickup in market sentiment and migration inflows, bolstering underlying demand.
Since 2010, the median house price has increased by 1.6% per annum. Cyclone Yasi and subsequent cyclones have increased home ownership costs and reduced buyers’ willingness to bid up prices.
Dwelling supply has recently picked up, especially in the unit sector which has remained in a prolonged period of undersupply. Population growth has led to a tightening in vacancy rates (to 1.5% as at June 2018). Notably, the median house price remained flat over the year at $420,000 in June 2018.
Read more about Cairns property prices: download the report.
Townsville

Townsville appears to have turned a corner after a significant period of depressed economic activity as a result of the decline in mining investment across regional Queensland. The unemployment rate has improved markedly, however, at 9.1% it is still significantly above the state and national average.
A lower Australian dollar has helped to boost tourism in the area and the cuts to State and Federal Government funding for defence and public administration jobs have largely been worked through. Construction activity has picked up in 2017/18 and looks to further increase in 2018/19, driven by the start of large infrastructure projects including the Townsville Integrated Stadium and Entertainment Centre development and Lavarack Barracks expansion. The residential market in Townsville appears to be approaching the bottom of its cycle. The median house price has been on a continuous descent for eight years, falling by a cumulative 16%.
Read more about Townsville property prices: download the report.
Launceston
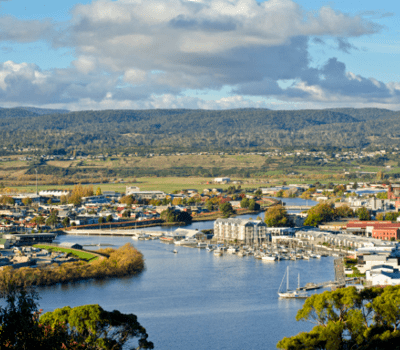
The improvement in the Tasmanian residential market has been concentrated in Hobart, with the other major Tasmanian centre, Launceston, largely lagging. However, there are signs now that an upturn in the Launceston residential market has emerged. After only 3% growth in 2016/17, Launceston’s median house price rose by 14.3% to $320,000 in the year to June 2018. The price growth has been accompanied by strengthening local economic conditions, with the unemployment rate in the Launceston Local Government Area improving from a high of 9.1% in September quarter 2016, to 7.1% in March quarter 2018.
Read more about Launceston property prices: download the report.